Earth Observation For Forecasting and Predictions
29th Mar 2023
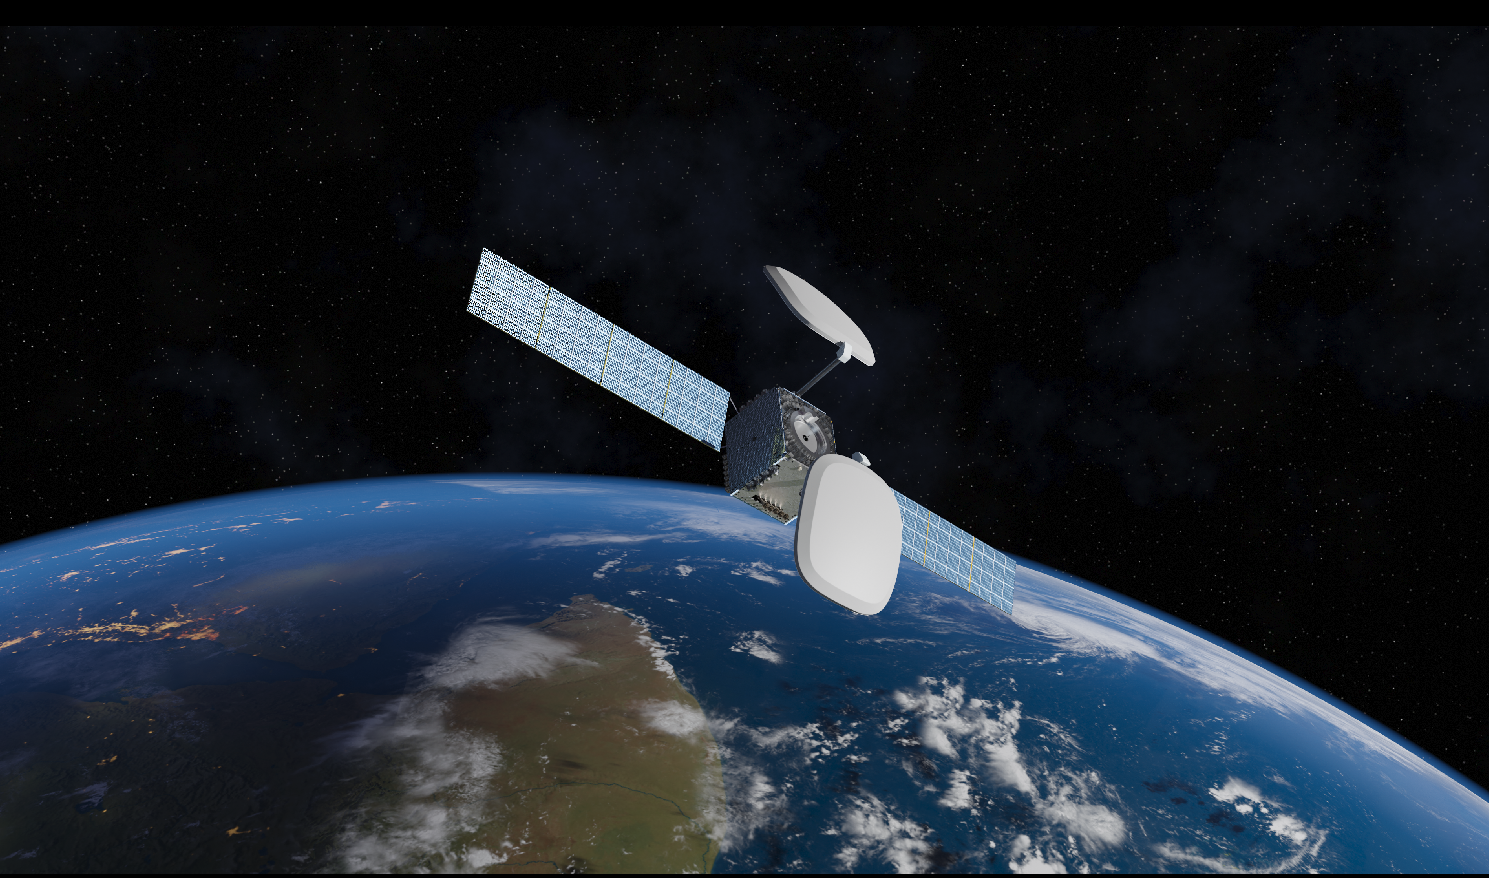
The Union of Concerned Scientists (UCS) states that there are currently over 3,000 active satellites orbiting the Earth. The data collected helps us to better understand many different aspects of our planet, and as technology advances, Earth Observation (EO) satellites are getting even better at assisting with analysis and predictions.
In the latest in our series on Earth observation satellites, we’re exploring the different methods that satellites can use to help us predict the future as well as understand the present.
Earth Observation and Weather Forecasting
One of the very best examples is also one of the oldest uses of Earth observation technologies; weather forecasting.
TIROS-1 (Television Infrared Observation Satellite) launched back in 1960, and was the first full-scale weather satellite. It used images of the Earth’s surface which showed meteorologists and forecasters what was happening around the world, using data such as cloud patterns.
There were many successors in the TIROS programme, which is still operational today, over 60 years on. There are a variety of other weather satellites that embrace numerous types of technology, and according to the World Meteorological Organization, there are “160 meteorological satellites in orbit today, creating about 80 million satellite observations per day”.
There are two main types of weather satellites. Polar-orbiting satellites stay in low-altitude orbits and monitor the whole planet in cycles of between 10 days and one month.
Geostationary satellites are also used, which stay at high altitude in line with the equator, and they move at the same speed as the Earth’s rotation, meaning they can track one stationary section of the planet. These satellites can help with larger storms and even tracking natural disasters and fires.
Types of Satellite Imagery Used in Weather Forecasting
There are three main types of imagery used to predict the weather
- Visible imagery. This can, of course, only be used when the sun is reflecting off the Earth and the clouds. The images can show cloud formations and their movement, as well as snow, frozen ground, and even developing thunderstorms as the clouds build.
- Infrared. These can be used 24 hours of the day. The sensors can measure heat radiating upward, show fog and low clouds, and can also help to determine the intensity of thunderstorms.
- Water Vapour Images. Vapour satellite images show the moisture levels in the upper atmosphere, roughly from 15,000 to 30,000 feet. This can indicate heavy rain as well as show humidity.
Different weather agencies interpret and process the data in different ways, using a combination of data to try to provide the most accurate forecasts.
The ability to track patterns and predict weather is not just great for knowing whether to pack a raincoat. Weather organisations are able to predict extreme weather such as tornado outbreaks and floods, heat waves, heavy snowfall, and wildfires. This means that weather forecasting saves lives. In history, tornadoes and other extreme weather conditions have cost thousands of lives that forecasting could have warned us about.
Predicting Climate Change and Marine Conditions
This is an area that is closely linked to predicting the weather, of course. Data collected by satellites is helping us to spot patterns and worrying signs of climate change.
Satellites currently in operation continue to monitor deforestation, polar ice caps, rising sea levels and gas emissions in the atmosphere, and while there is no way for satellites to see the future, the evidence collected over recent decades is clear.
For instance, satellites can track levels of carbon dioxide and methane in the atmosphere to see the human impact on changing climate. A study from 2018 showed that carbon dioxide rose to 407 ppm and that methane concentrations are now around 150% above pre-industrial levels (Buchwitz, M. et al. 2018).
According to the ESA, the “total combined loss of ice mass across Greenland and Antarctica is estimated at 6.4 trillion tonnes between 1992 and 2017 – pushing global sea levels up by 17.8 millimetres.” Only by using Earth Observation satellites are we able to gather this sort of data.
Satellite imaging is able to show the long-term glacier changes and monitor a lot of useful data, including surface area, height, mass and the speed at which glaciers flow. This data can be interpreted and processed to predict the impacts of climate change over the coming decades.
Marine waters are tracked closely, for instance, using the Environmental Marine Information System, enabling people to conduct regional assessments of marine conditions and the ecological structure of seas and coastlines. The marine data is made available to the scientific community through a geographic information system (GIS) tool.
Deforestation
Satellite images show the changes to the Earth’s rainforests, and worrying trends have been observed over the decades. Satellite images showed us that the Brazilian rainforest, the Amazon, was losing around 20,000 square kilometres every single year. It was relatively simple for scientists to predict the long-term impacts of losing our rainforests based on prior data.
In 2004, the Brazilian Government heeded the warnings and implemented the Action Plan for the Prevention and Control of Deforestation in the Legal Amazon (PPCDAm). This meant protected areas and territories and more restrictions for goods that were made on illegally deforested land.
Within seven years, forest clearing in the Amazon had dropped around 80 percent, and is a huge success story in environmental
Satellite-based monitoring systems played a key role in predicting what the future held for the Amazon, and promoted an intervention and policy changes that started to reverse the trend.
Population Trends
It is virtually impossible for us to ever gain 100% accurate population data from around the world. In many countries, census and population data is unreliable, and of course, ever-changing. The Department for International Development (DFID) was able to apply satellite image data along with micro-census data to understand populations in locations such as the Democratic Republic of Congo and Mozambique.
DFID worked with the United Nations Population Fund as well as the University of Southampton and Columbia University to analyse data and identify features such as buildings, transport networks, lighting, industrial areas, and boundaries in villages, towns and other settlements. Using an algorithm partially driven by AI, they were also able to predict the density of the population in these areas.
Further studies in the area include “A Deep Learning Approach for Population Estimation from Satellite Imagery” by Caleb Robinsond, Fred Hohman, and Bistra Dilkina which used various complex models to interpret the data provided by satellites.
The Future of Predicting the Future
Earth Observation technology continues to grow at a rapid rate, with more satellites launching every single year. Higher definition, and more detailed forms of imaging provide even more information, and with machine learning and AI that data can be interpreted in more insightful and accurate ways than ever before, growing our understanding of our planet and the ways in which it is constantly changing.


Thank you for your comment! It will be visible on the site after moderation.